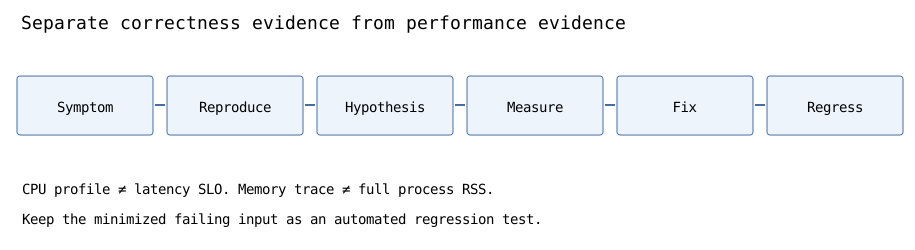
Debugging and profiling answer different questions: debugging explains why behavior violates a contract, whereas profiling identifies where execution spends time or allocates memory. They must work together. Optimizing a function before reproducing the bug can make the defect less obvious; diagnosing a slow endpoint from one log line can lead to rewriting the wrong component. A sound workflow is to reproduce, isolate, form a hypothesis, collect discriminating evidence, fix the cause, and protect the result with a regression test [1][2].
Establish an observable failure#
Start with a symptom stated as an input, expected output and actual output. Imagine a function that should return the first index whose value is at least a target in a sorted array. The relevant contract includes empty input (return the length, zero), duplicate values (first match), and targets beyond the largest element (return length). If a caller requests the first matching item for [1,3,3,5] and target 3, returning index 2 violates the contract even though value 3 is present.
Keep an executable minimal reproducer; remove network calls, UI and nondeterministic dependencies until the failure persists in the smallest case. A reproducible failing example is a more valuable artifact than a screenshot of a stack trace without inputs. Record runtime version, data shape and any concurrency assumptions when they affect behavior.
Localize with an invariant, not guesses#
Binary search maintains a half-open interval [left,right) containing the first position satisfying a[i] >= target. Initialize left=0 and right=n. At midpoint, if a[mid] is smaller than target, every index through mid is invalid, so set left=mid+1. Otherwise mid can be the answer and the right boundary becomes mid. The interval strictly shrinks; when left==right, that index is the lower bound.
def first_at_least(values, target):
    left, right = 0, len(values)
    while left < right:
        mid = (left + right) // 2
        if values[mid] < target:
            left = mid + 1
        else:
            right = mid
    return left

assert first_at_least([], 7) == 0
assert first_at_least([1, 3, 3, 5], 3) == 1
assert first_at_least([1, 3, 3, 5], 4) == 3
assert first_at_least([1, 3, 3, 5], 9) == 4
assert first_at_least([3, 3, 3], 3) == 0
The code assumes an already sorted sequence with a consistent total ordering. It uses O(log n) comparisons and O(1) auxiliary space under random access and constant-time comparisons. On an unsorted array, its invariant is false and the result may be arbitrary. A different mistake—using <= instead of <—changes lower bound to upper bound and skips all equal keys.
Build an independent regression oracle#
A test that simply repeats the same binary search could share its defect. Instead, compare with a slower but obviously correct linear scan for short cases. Exhaustively enumerate nondecreasing arrays of a few elements and a range of targets. This is bounded model checking of examples, not a proof for all inputs; the interval invariant supplies the broader correctness argument.
from itertools import combinations_with_replacement

def linear_lower_bound(values, target):
    for i, item in enumerate(values):
        if item >= target:
            return i
    return len(values)

for length in range(6):
    for tup in combinations_with_replacement(range(4), length):
        values = list(tup)
        for target in range(-1, 6):
            assert first_at_least(values, target) == linear_lower_bound(values, target)
Preserve any newly found counterexample as a regression test. When a bug occurs only with production data, minimize a sanitized failing dataset; never copy credentials, user records or other sensitive payloads into public test fixtures.
Time profiling versus latency measurement#
A profiler reports where code runs; a benchmark asks how long a specific workload takes. Python's cProfile records function-level call counts and timing statistics and can be inspected with pstats [1]. The wall-clock timer time.perf_counter measures elapsed time between calls, not CPU time alone; I/O waits, scheduling and interpreter warmup affect its values [3].
import cProfile
import pstats
import io
from time import perf_counter

def square_sum(n):
    return sum(x * x for x in range(n))

profiler = cProfile.Profile()
start = perf_counter()
profiler.enable()
answer = square_sum(1000)
profiler.disable()
elapsed = perf_counter() - start
report = io.StringIO()
pstats.Stats(profiler, stream=report).sort_stats("cumulative").print_stats(5)
assert answer == 332833500
assert elapsed >= 0
assert report.getvalue()
Do not claim that the tiny sample's elapsed time represents production performance. Profiling itself adds overhead; compare optimized versions on equivalent input distributions with warmup and multiple independent trials. For asynchronous services, examine queue waits, remote calls and lock contention separately from Python CPU time.
Heap growth and tracemalloc#
An increasing process RSS does not necessarily mean leaked Python objects: allocators retain memory, caches warm up, native libraries allocate buffers, and garbage collection changes timings. Python's tracemalloc traces allocations managed by Python and allows snapshots and allocation-site comparison [2]. It does not, by itself, account for every native allocation or prove a leak.
import tracemalloc

tracemalloc.start()
buffer = [bytes(128) for _ in range(64)]
current, peak = tracemalloc.get_traced_memory()
assert current >= 0 and peak >= current
assert len(buffer) == 64
tracemalloc.stop()
To investigate growth, repeat the same operation across many iterations, hold constant inputs, compare snapshots, check object lifetimes and then correlate with process RSS and native profiling when appropriate. A snapshot taken during startup and another after a cache has filled may show legitimate retained data, not an unbounded leak.
Production debugging through telemetry#
Logs explain discrete events; metrics quantify rates and distributions; distributed traces link work across services. OpenTelemetry documents these observability signals and instrumentation approaches [4]. Correlate requests with a trace identifier and include tenant-safe metadata, dependency duration, retry count and error category. Avoid dumping credentials or personal data to gain observability.
For a rising p99, separate traffic-mix changes, queueing, cold caches, database plan regression, CPU saturation and external dependency slowdown. A log message saying “timeout” is a symptom, not evidence of where the deadline was consumed. Compare successful and failing traces, deploy versions and resource telemetry before selecting a fix.
A disciplined correction and rollback loop#
| Observation | Hypothesis | Evidence to seek |
|---|---|---|
| Wrong index for duplicates | Equality branch skips matches | Minimal duplicate fixture and invariant |
| CPU at saturation | Quadratic algorithm | Profile call counts by input size |
| High p99 with normal CPU | Remote wait or queue backlog | Traces, queue depth, endpoint percentiles |
| Increasing RSS | Retained objects or native buffers | Snapshots, allocation and RSS trends |
| Errors began after release | Code or schema regression | Version segmentation and rollback check |
One test passing after a fix does not prove the system safe. Check neighboring contracts, run integration tests for the affected boundary and compare metrics after deployment. Revert when impact exceeds the risk budget, then investigate separately.
Exercises and verification#
- Show why using
values[mid] <= targetanswers a different binary-search question on duplicates. - Explain why the exhaustive oracle here is stronger than two hand-written tests but is still not a proof for unbounded arrays.
- Distinguish cProfile function cost, perf_counter elapsed time and tracemalloc allocations.
- Design a safe production experiment that distinguishes database wait from CPU bottleneck for a slow endpoint.
- Specify what logs, traces, metrics and rollback signals you would preserve for a regression incident.
Related chapters: Binary search, testing strategies, production incident response and distributed observability build on this method.