Observability is the ability to reason about internal system behavior from emitted signals. A dashboard does not create observability by itself: engineers must know which user-facing contract the signals measure, how requests are correlated, and which failures the collection pipeline might hide. Distributed services require complementary evidence from metrics, logs and traces, together with explicit service-level objectives (SLOs) [1][3].
Define the measured service before choosing charts#
First write a service-level indicator (SLI) as a ratio or distribution with a defined population. For instance, availability over a 30-day window might mean successful eligible HTTP requests divided by all eligible HTTP requests in that interval. 'Eligible' matters: intentionally excluded health checks and client cancellations can alter the denominator. An SLO is a target for that indicator, not a guarantee that every individual user operation succeeds.
The four golden signals recommended in Google SRE are latency, traffic, errors and saturation [3]. Traffic can be completed requests per second, not merely connection count. Errors should follow business semantics, distinguishing a deliberate invalid user request from an internal failure. Saturation may involve queue depth, CPU, disk, connection pools or a downstream quota; CPU percentage alone is not an overload model.
Metrics and percentiles#
Metrics aggregate measurements across time and dimensions. A counter normally increases with observed events (except resets); a gauge represents an instantaneous value; histograms preserve distributions in buckets that can be aggregated according to their definition. If your service returns 200 successes in 100 ms and 5 failures in 4 ms, one combined mean latency conceals the user-visible failures. Separate successful and failed request latency and report end-to-end duration across an agreed boundary [3].
A percentile is a property of an observed collection or distribution, not the average of per-host percentiles. In general, p99(service A) plus p99(service B) is not p99(end-to-end request), because slow samples need not occur on the same requests. For fan-out to several dependencies, tail latency may be dominated by the slowest dependent operation even when individual average latencies are modest. Use complete traces or correctly aggregated histograms before making an SLO claim.
Traces, spans and causal correlation#
A trace represents related operations across service boundaries. Each span describes a unit of work and carries a trace ID, span ID, timing and optional attributes, events and links [1]. W3C Trace Context standardizes the traceparent and tracestate headers used to propagate identifiers between compatible components [2]. An HTTP gateway can create a root span, pass trace context to a worker, and correlate that worker's database call even when it executes in another process.
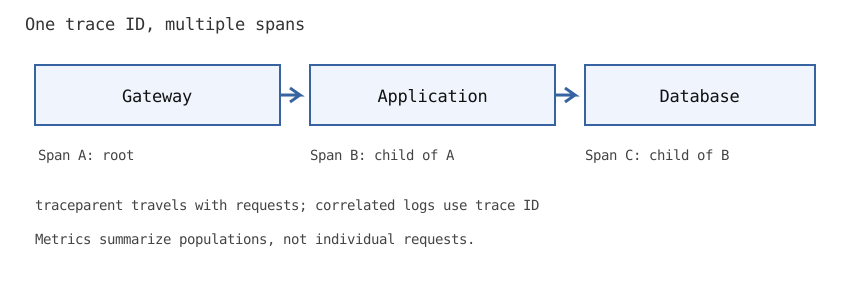
A trace graph and a call stack are not identical: asynchronous queues may continue a logical workflow after the originating HTTP request returns. Span links can represent causal relationships that are not simple parent-child calls. Propagating context across message brokers requires explicit extraction and injection; losing a trace header creates fragmented visibility even if each service logs correctly.
Logs, privacy and cardinality#
Logs capture events with structured fields such as timestamp, operation type, outcome, trace ID and error category. They are most useful when statements can be correlated to spans and service versions. Never log bearer credentials, passwords or unredacted sensitive request bodies. Beware that OpenTelemetry baggage can propagate arbitrary key-value fields through many downstream services and is not an authorization mechanism; untrusted baggage must not decide privileges [4].
Cardinality is the number of distinct label-value combinations for a time series. If a metric is labeled by 20 endpoints, 5 status families and 3 regions, it may already have up to 300 series. Adding a label with 1,000,000 user IDs can multiply that figure drastically. Prefer bounded labels for metrics and use restricted logs or traces when per-request identifiers are genuinely necessary.
Calculate an error budget reproducibly#
For request-based SLO target S and N eligible requests, the permitted failure count is (1−S)×N for the same observation window. Suppose S=99.9% and N=10,000: the budget is 10 unsuccessful requests. If 25 failed, the window consumed 250% of its nominal failure allowance. This is budget consumption, not proof that each failure had identical user impact. Burn-rate alerts compare observed failure rate with allowed rate; they are useful for detecting an excessive rate of consumption before a long SLO window closes [3].
from math import ceil

def nearest_rank(values, fraction):
    if not values or not 0 < fraction <= 1:
        raise ValueError("nonempty sample and fraction in (0, 1] required")
    data = sorted(values)
    return data[ceil(fraction * len(data)) - 1]

def error_budget(eligible, failed, target):
    if eligible <= 0 or not 0 <= failed <= eligible or not 0 < target < 1:
        raise ValueError("invalid request counts or target")
    allowed = eligible * (1 - target)
    return {"allowed": allowed, "consumed": failed / allowed}

assert nearest_rank([10, 20, 25, 40, 100], 0.8) == 40
assert nearest_rank([10, 20, 25, 40, 100], 0.99) == 100
budget = error_budget(10000, 25, .999)
assert round(budget["allowed"]) == 10
assert round(budget["consumed"], 2) == 2.50
The nearest-rank formula is one percentile convention; other interpolation conventions produce different estimates from small samples. The SLO calculation assumes request-count weighting. A time-based SLO or per-operation importance weighting uses another measure. Short windows may have very low counts and noisy rates; policy must handle uncertainty instead of alarming on every isolated sample.
Sampling and invisible failures#
Recording every high-volume trace may cost excessive network and storage resources. Head sampling chooses before the full trace is known; it can miss rare slow or failed operations. Tail sampling can inspect completed traces but may require buffering and coordination. If you retain one trace per thousand requests, you cannot conclude no errors occurred simply because no retained trace contained one. Error metrics should come from an appropriately reliable measurement path, not inferred solely from sampled traces.
A telemetry collector, exporter or backend can itself fail or drop events. Monitor ingestion delay, dropped spans, clock offset and queue saturation in the observability pipeline. Percentiles computed from only surviving traces can show optimistic numbers precisely during overload incidents.
An incident walkthrough#
Imagine service latency p99 increases from 120 ms to 900 ms after a deploy. First identify the impacted user operation, time and region; compare successful and failed samples. Check offered traffic, queue depth, CPU and downstream saturation. Open representative complete traces to determine whether duration moved into database, cache miss, network connect or application work. Compare before/after versions and identify concurrent changes; temporal correlation is not automatically causation.
If the latency increase follows a rise in database lock waits, inspect lock owners and transaction durations before adding web replicas. Scaling the wrong tier can intensify contention. Establish a rollback trigger and test whether restoring the prior version also restores measured behavior.
Failure matrix and practice#
| Diagnostic trap | Why it fails | Better evidence |
|---|---|---|
| One global latency average | Erases tails and error cohorts | Histograms by bounded operation classes |
| Trace sample contains no errors | Sampling may miss rare failures | Error counters plus trace examples |
| User IDs used as metric labels | Extreme cardinality and cost | Bounded labels, trace IDs in logs |
| All spans have local IDs only | Cross-service causal chain lost | W3C context propagation |
| Dashboard has no SLO definition | Cannot decide impact or budget | Written population, window, success rule |
Related reading: Reliable APIs defines deadlines and observable failures; capacity estimation covers measurement under saturation; networking fundamentals locates connection, TLS and HTTP time budgets.
Exercises and verification#
- Derive the 99.9%-availability request error budget for 50,000 eligible calls. Answer: 50 failures; identify what counts as failure.
- Show why a mean latency of 50 ms does not forbid a one-second p99 outlier under a suitable sample distribution.
- Explain why combining host p99 values by arithmetic average does not yield a global p99.
- Design a trace across HTTP gateway, broker and consumer; distinguish parent-child spans from causal span links.
- List three telemetry fields that should not enter globally propagated baggage and justify privacy or trust-boundary concerns.